Efficiency is a big deal when it comes to the workplace, and a lot of companies like to see how many hours go into big projects. That’s why I’m doing something a little different with the cool new printable time sheets at PrintableTimeSheets.net. All of them are project management templates that use charts and graphs to show how much time has gone into a project.
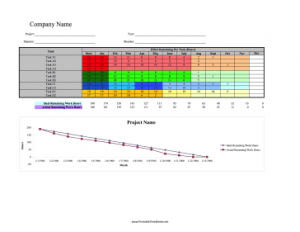
The new project management time sheets are visually attractive and easy to use. Many of them track the hours that go into a project and its smaller tasks, and then create a graph that compares the ideal number of hours with the actual hours worked. There are also templates that show progress, overtime, multiple workers, and multiple projects. The charts and graphs update automatically depending on the values entered.
You can choose from Gantt charts, PERT charts, Critical Analysis time sheets, Burndown rates, percentage breakdowns, pie charts, bar charts, and line graphs.
In addition to the new project management templates, I also have daily, weekly, monthly, and biweekly time sheets. PrintableTimeSheets.net has 159 time sheets available as a free PDF or a $9 XLS file. With Microsoft Excel, the XLS version will automatically calculate hours, breaks, wages, taxes and more.